Quantitative modeling of membrane deformations by multihelical membrane proteins
By Sayan Mondal, George Khelashvili, Jufang Shan, Olaf S Andersen, and Harel Weinstein
Published in Biophysical Journal 101(9): 2092-101 on November 2, 2011.
PMID: 22067146. PMCID: PMC3207176. Link to Pubmed page.
Core Facility: Computational Modeling
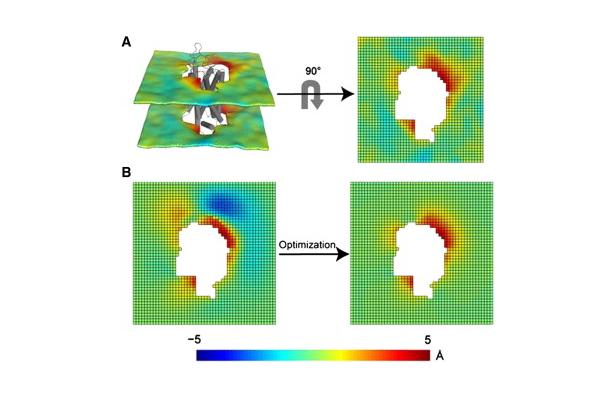
Figure 1. Protocol for the 3D-CTMD approach, illustrated for rhodopsin in a diC14:1PC lipid bilayer. (A) The membrane-deformation profile u(x,y) calculated directly from the MD simulations. The left panel is the deformation profile as a color map projected onto the surface defined by fitting a grid (spacing 2 Å) to the positions of the phosphate atoms in the two leaflets during the trajectory, followed by time averaging and spatial smoothing. The right panel shows the same deformation color map on the x-y plane. (B) The membrane-deformation profile u(x,y) on a 100 × 100 Å patch, calculated with 3D-CTMD. The left panel represents the membrane shape calculated with the deformation boundary condition at the membrane-protein interface from the MD profile in panel A and a random curvature boundary condition to produce the starting point for the free-energy-based optimization (Eqs. S2 and S3). The right panel is the membrane-deformation profile calculated with the natural boundary condition, which minimizes the membrane-deformation energy penalty. Note the agreement between the profiles in A, calculated using a microscopic theory, and B, calculated using the continuum theory (they are within 0.5 Å RMSD of each other). The 3D-CTMD approach also allows evaluation of the protein-induced membrane-deformation energy penalty, which is 4.7 kT in this case.
Abstract
The interpretation of experimental observations of the dependence of membrane protein function on the properties of the lipid membrane environment calls for a consideration of the energy cost of protein-bilayer interactions, including the protein-bilayer hydrophobic mismatch. We present a novel (to our knowledge) multiscale computational approach for quantifying the hydrophobic mismatch-driven remodeling of membrane bilayers by multihelical membrane proteins. The method accounts for both the membrane remodeling energy and the energy contribution from any partial (incomplete) alleviation of the hydrophobic mismatch by membrane remodeling. Overcoming previous limitations, it allows for radially asymmetric bilayer deformations produced by multihelical proteins, and takes into account the irregular membrane-protein boundaries. The approach is illustrated by application to two G-protein coupled receptors: rhodopsin in bilayers of different thickness, and the serotonin 5-HT(2A) receptor bound to pharmacologically different ligands. Analysis of the results identifies the residual exposure that is not alleviated by bilayer adaptation, and its quantification at specific transmembrane segments is shown to predict favorable contact interfaces in oligomeric arrays. In addition, our results suggest how distinct ligand-induced conformations of G-protein coupled receptors may elicit different functional responses through differential effects on the membrane environment.
 for rhodopsin immersed in lipid bilayers of different bulk thicknesses. The upper panel shows u(x,y) calculated directly from MD trajectories for rhodopsin in bilayers composed of (A) diC14:1PC, (B) diC20:1PC, and (C) 7:7:6 SDPC/POPC/Chol membranes. The lower panel shows the corresponding membrane-deformation profiles u(x,y) for (D) diC14:1PC, (E) diC20:1PC, and (F) 7:7:6 SDPC/POPC/Chol calculated using the 3D-CTMD approach. The corresponding membrane-deformation energies ΔGdef are (D) 4.7 kBT, (E) 2kBT, and (F) 2.6 kBT. The calculated ΔGdef is 1.6 kT for rhodopsin in diC16:1PC, and 0.8 kT for rhodopsin in diC18:1PC.")
 A snapshot from the MD trajectory of rhodopsin in the thin diC14:1PC bilayer. TM5 is shown in blue, and two residues (Glu-5.36 and Phe-5.63) are highlighted. (B) A snapshot of rhodopsin in the thick diC20:1PC bilayer. The diC20:1PC bilayer thins near Glu-5.36, which substantially reduces its exposure to the hydrophobic core of the bilayer, thus showing hydrophobic adaptation. Phe-5.63 remains unfavorably exposed to the polar environment in the thin diC14:1PC bilayer but not in the thick diC20:1PC bilayer. Thus, Phe-5.63 contributes to residual exposure energy penalty at TM5 for rhodopsin in diC14:1PC. The residual exposures are computed over the course of the MD trajectory.")