Conformational Transitions in P-class ATPases update, year 1
Summary of Progress
1. Dynamics underlying ion binding/release steps by the Na/K pump.
Measurement of transient currents. Kinetics of pre-steady-state currents allow direct measurements of the rates of rate-limiting steps associated with the occlusion/deocclusion steps within the pump cycle.
In this aim we have measured the pre-steady-state currents at high resolution using the giant axon of the Humboldt squid Dosidicus gigas. The large diameter of these axons allowed, for the first time, to record robust currents in a large range of temperatures and thus infer the energetic landscape of the reactions involved in the unbinding and deocclusion of the deeply occluded Na ion.
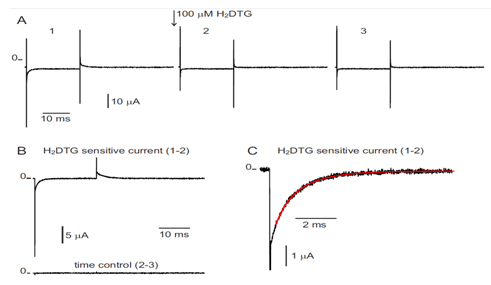 Figure 1 Na+ translocation by the Na+/K+-ATPase. Click to enlarge.
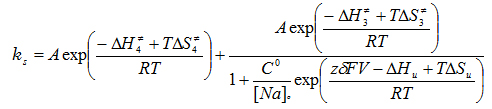
Figure 1 shows an experiment and the extraction of the slow component of the transient current which corresponds to the reaction of the deeply occluded Na ion. Using a total of 150 determinations done in a range of 17 to 32o C and between -120 and 40 mV, we did a global fit to the following equation that gives the overall rate of the reactions involving the binding/unbinding and occluding/deoccluding of the first Na ion (click to enlarge):
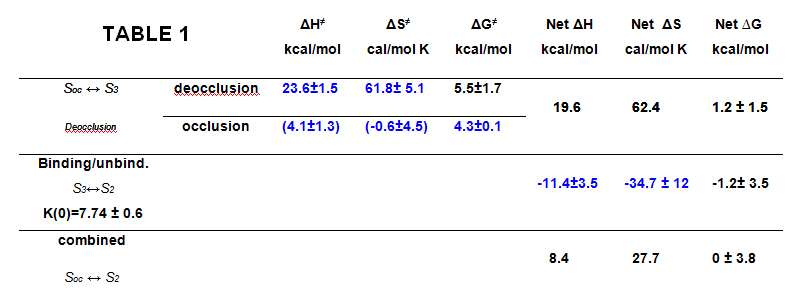
The fitted thermodynamic parameters are shown in Table 1.
The energetic landscape of the transitions associated with the extracellular release of the first Na+ from the deeply occluded state revealed that the occlusion/deocclusion transition involves large changes in enthalpy and entropy as the ion is exposed to the external milieu for release. Clearly, ion unbinding (through the access channel) must carry some amino acid side chain rearrangements at the site, since the enthalpic activation energy of the binding/unbinding reaction was substantially larger than expected for an ion diffusing through a permeation pathway. This study provides the initial framework for further investigations on the energetic landscape for the release of the second and third Na+, to begin building a precise description of the molecular events that accompany the translocation of Na+ by the Na+/K+-ATPase. A paper is now in print in PNAS.
2. Position of ouabain in a functioning Na/K pump
Here, we use a spectroscopic approach to estimate distances between a fluorescent ouabain and a lanthanide binding tag (LBT), which was introduced at five different positions in the Na+/K+ ATPase sequence. These five normally functional LBT-Na+/K+ ATPase constructs were expressed in the cell membrane of Xenopus laevis oocytes, operating under physiological internal and external ion conditions. The spectroscopic data suggest two mutually exclusive distances between the LBT and the fluorescent ouabain. From the estimated distances and using homology models of the LBT-Na+/K+ ATPase constructs, approximate ouabain positions could be determined. Our results suggest that ouabain binds at two sites along the ion permeation pathway of the Na+/K+ ATPase. The external site (low apparent affinity) occupies the same region as previous structural findings. The high apparent affinity site is, however, slightly deeper towards the intracellular end of the protein. Interestingly, in both cases the lactone ring faces outward. We propose a sequential ouabain binding mechanism that is consistent with all functional and structural studies. J Biol Chem. 2011 Sep 12. [Epub ahead of print].
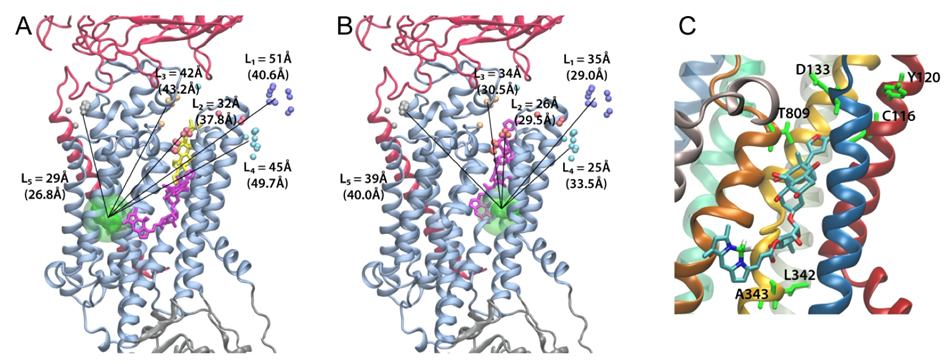
Figure 2. Positions of ouabain determined from the LRET distances measured between the 5 LBT insertions and the Bodipy attached to ouabain. A. High affinity binding site. B. Low affinity binding site. Small colored spheres (gray, cyan, blue, white, gold) indicate the position of the terbium metal for each of the 5 LBT insertion constructs. For each insertion, 10 models generated with Modeller were used. The lines indicate the five experimentally determined LRET distances (numbers between parentheses). L1, L2, L3, L4 and L5 correspond to LBTs inserted at positions 125, 134, 318, 324 and 988, respectively. The green density represents the average optimal position of Bodipy determined from a simulation of a dummy atom held by 50 harmonic distance restraints. The average distances from the dummy atom to Tb3+ in each LBT are shown without parenthesis. In panel A, the location of ouabain in the crystal structure is visualized in yellow stick representation. The modeled positions of Bodipy-Fl Ouabain are shown in violet stick representation. C. The ouabain’s modeled position of the high affinity binding site is shown with the nearest residues of the squid Na+/K+-ATPase identified with high impact on the binding of ouabain using site directed mutagenesis. The equivalence of the squid residues with the corresponding sheep residues is as follows (squid – sheep): C116-C104, Y120-Y108, D133-D121, N134- N122, Y320-Y308, L342-L330, A343-A331, T809-T797.


